|
|
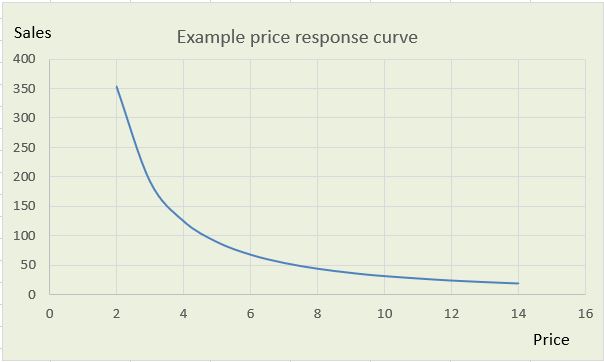
 Price sensitivity model - price response curveThe purpose of a price sensitivity model is to define the way that price affects demand for products or services. It reflects the mathematical relationship between price and demand in the form of a price response curve. A price sensitivity model helps in the formulation of pricing strategy and can be a vital factor in demand forecasting. We carry out the price sensitivity analysis based on historical company sales and historical prices using advanced statistical software. This method, using real data, has a much lower cost than carrying out elaborate market research and is much lower risk than real-world experimentation. Because the extent to which price affects demand relates to competitor prices, it can be helpful for the price sensitivity model to be based on an index of company price relative to total market price or some key competitor price. If the business is subject to additional causal factors such as the weather or key economic indices such as real disposable income, it may be desirable to include these other factors, together with price or price index, in a broader causal analysis. Price Response CurvesA wide range of mathematical curves can potentially be used to describe price sensitivity in the form of a price response curve. Having said that, a linear (straight line) relationship can often be useful, particularly if historical prices have only varied across a fairly narrow range. Linear regression is a method that is available in all statistical software packages and it is a standard technique that gives the same results across different software. Also, a select number of curve types can be transformed to linear form using logarithmic mathematics, so are also relatively easy to use. These include poynomials, the exponential curve and the power curve, as available in Excel. The power curve is somewhat special in that it exhibits a constant price elasticity (see below) at all points on the price response curve.
Price ElasticityPrice elasticity is one way of describing price sensitivity and the effect of price change. Price elasticity is defined as the % change in sales likely to take place as a result of a 1% change in price. As increased price results in a reduction in demand the price elasticity of demand will always be a negative figure. Unit price elasticity refers to the specific situation where a 1% change in price causes exactly a 1% decrease in sales. In most price models, including simple linear relationships, the price elasticity will vary depending on the particular point of reference on the demand curve. So the elasticity from a point where the price is 8.00 may vary from the elasticity when the price is 9.00. The elasticity at particular price may is then referred to as the "point price elasticity of demand". Cause and Effect AnalysisIn cause and effect analysis, or causal analysis, the aim is to quantify the effect of factors which are suspected of causing shifts in sales volume or marketshare. Price sensitivity analysis in the form of pricing models and demand curves is one special example. Other causal factors such as unseasonal weather or economic indices may also play a part. So a full cause and effect analysis incorporating the effects of other factors as well as pricing may lead to a fuller understanding and a better platform for the formulation of pricing and other business strategy When a causal relationship has been identified and quantified it can immediately help to explain variations that have been experienced in historical demand. That is in itself is very helpful, but to make full use of a pricing model or other causal model in forecasting it is necessary to forecast the future values of the causal factor itself before one can calculate the demand forecast. If the causal factor is a leading indicator and/or some well known index such as GDP or RPI for which other organisations publish forecasts, the task may be somehat easier. Need for expert helpSpecialist software is invaluable in carrying out price sensitivity analysis and other causal analysis. Care is needed to avoid confusion of the results with natural seasonality or inherent trends in market size or share. Also, it is usually necessary to explore a range of possible time lags in the response of demand to changes in the causal factors. Forecast Solutions Planning can expertly carry out the work using specialist statistical software, analysing the effect of causal factors such as pricing, weather, economic indices or sales force calling patterns. The results can then be taken into account in defining pricing and other business strategy, and may be incorporated into the demand forecasting process. |